EM Monthly: Fear of the snake
EM Monthly
February 14, 2025
If you have any feedback on this article or are interested in subscribing to our content, please contact us at opinions@muzinich.com or fill out the form on the right hand side of this page.
--------
The year of the snake may be prescient in determining how Eastern economies respond to a second Trump term and the uncertainties it may bring, as Mel Siew explains.
Often a symbol of danger in the West, in the East snakes are seen as wise, strategic and able to navigate complex situations. In 2025, the Chinese New Year coincided with a new US administration, with pre-election rhetoric dominated by threats of tariffs and trade wars. So far, however, speculation and reality are distant cousins as China, on the receiving end of Trump’s first-term foreign policy, appears to be less of a target than countries closer to home.
While fears of a resurgent trade war are not unfounded, times have changed and China with it. Meanwhile, for investors in Asian credit, as China’s dominance is diluted and diversification increases, the relative appeal of the sub-asset class is returning.
Not as much as feared - yet
The US was quick to implement trade tariffs following Trump’s inauguration, with executive orders imposing additional tariffs on Canada, Mexico and China. However, Trump for now appears less concerned with China, with its imports set for an additional 10% tariff hike, lower than the 25% hike set to be imposed on imports from countries bordering the US and a fraction of the 60% increase touted during the election campaign.
While this could increase, especially after trade investigation results are released later in the year, Trump’s rhetoric has arguably softened towards China. Discussions appear more targeted, suggesting tariffs will be a negotiation tool for other goals; for example, Colombia recently acquiesced in accepting deported nationals when threatened with tariffs.1
Shrinking trade deficit
The US’s largest trade deficit is with China (Figure 1), but it has shrunk significantly since 2017, in US dollar terms and as a share of the total US trade deficit (from 47% in 2017 to 25% in 2024).2 Meanwhile, US deficits with Canada and Mexico have increased, as have those with broader Asia and the European Union (EU).
Mexico, China and Canada account for over 40% of US imports (Figure 2). However, there is a sharp decline beyond these countries, which could explain the lack of targeting any other countries and the focus on the EU, with the bloc representing 18.6% of US imports.3
China less exposed to tariffs
A similar trend can be seen with Chinese exports (Figure 3). The relative importance of the US has reduced, with Chinese exports to the Association of Southeast Asian Nations (ASEAN) countries larger than its exports to the US or EU. Meanwhile certain ASEAN country trade deficits with the US have increased. By re-basing facilities in ASEAN, companies can localize production to take advantage of new high-growth markets while continuing to serve the US.
Economic recovery in China
For the first time in 14 years, China’s monetary policy stance has changed to “moderately loose”,4 compared to the “prudent” focus in 2017-2018.5 This is a strong signal authorities are focused on growth, which logically should increase the country’s ability to offset any negative impacts from tariffs.6
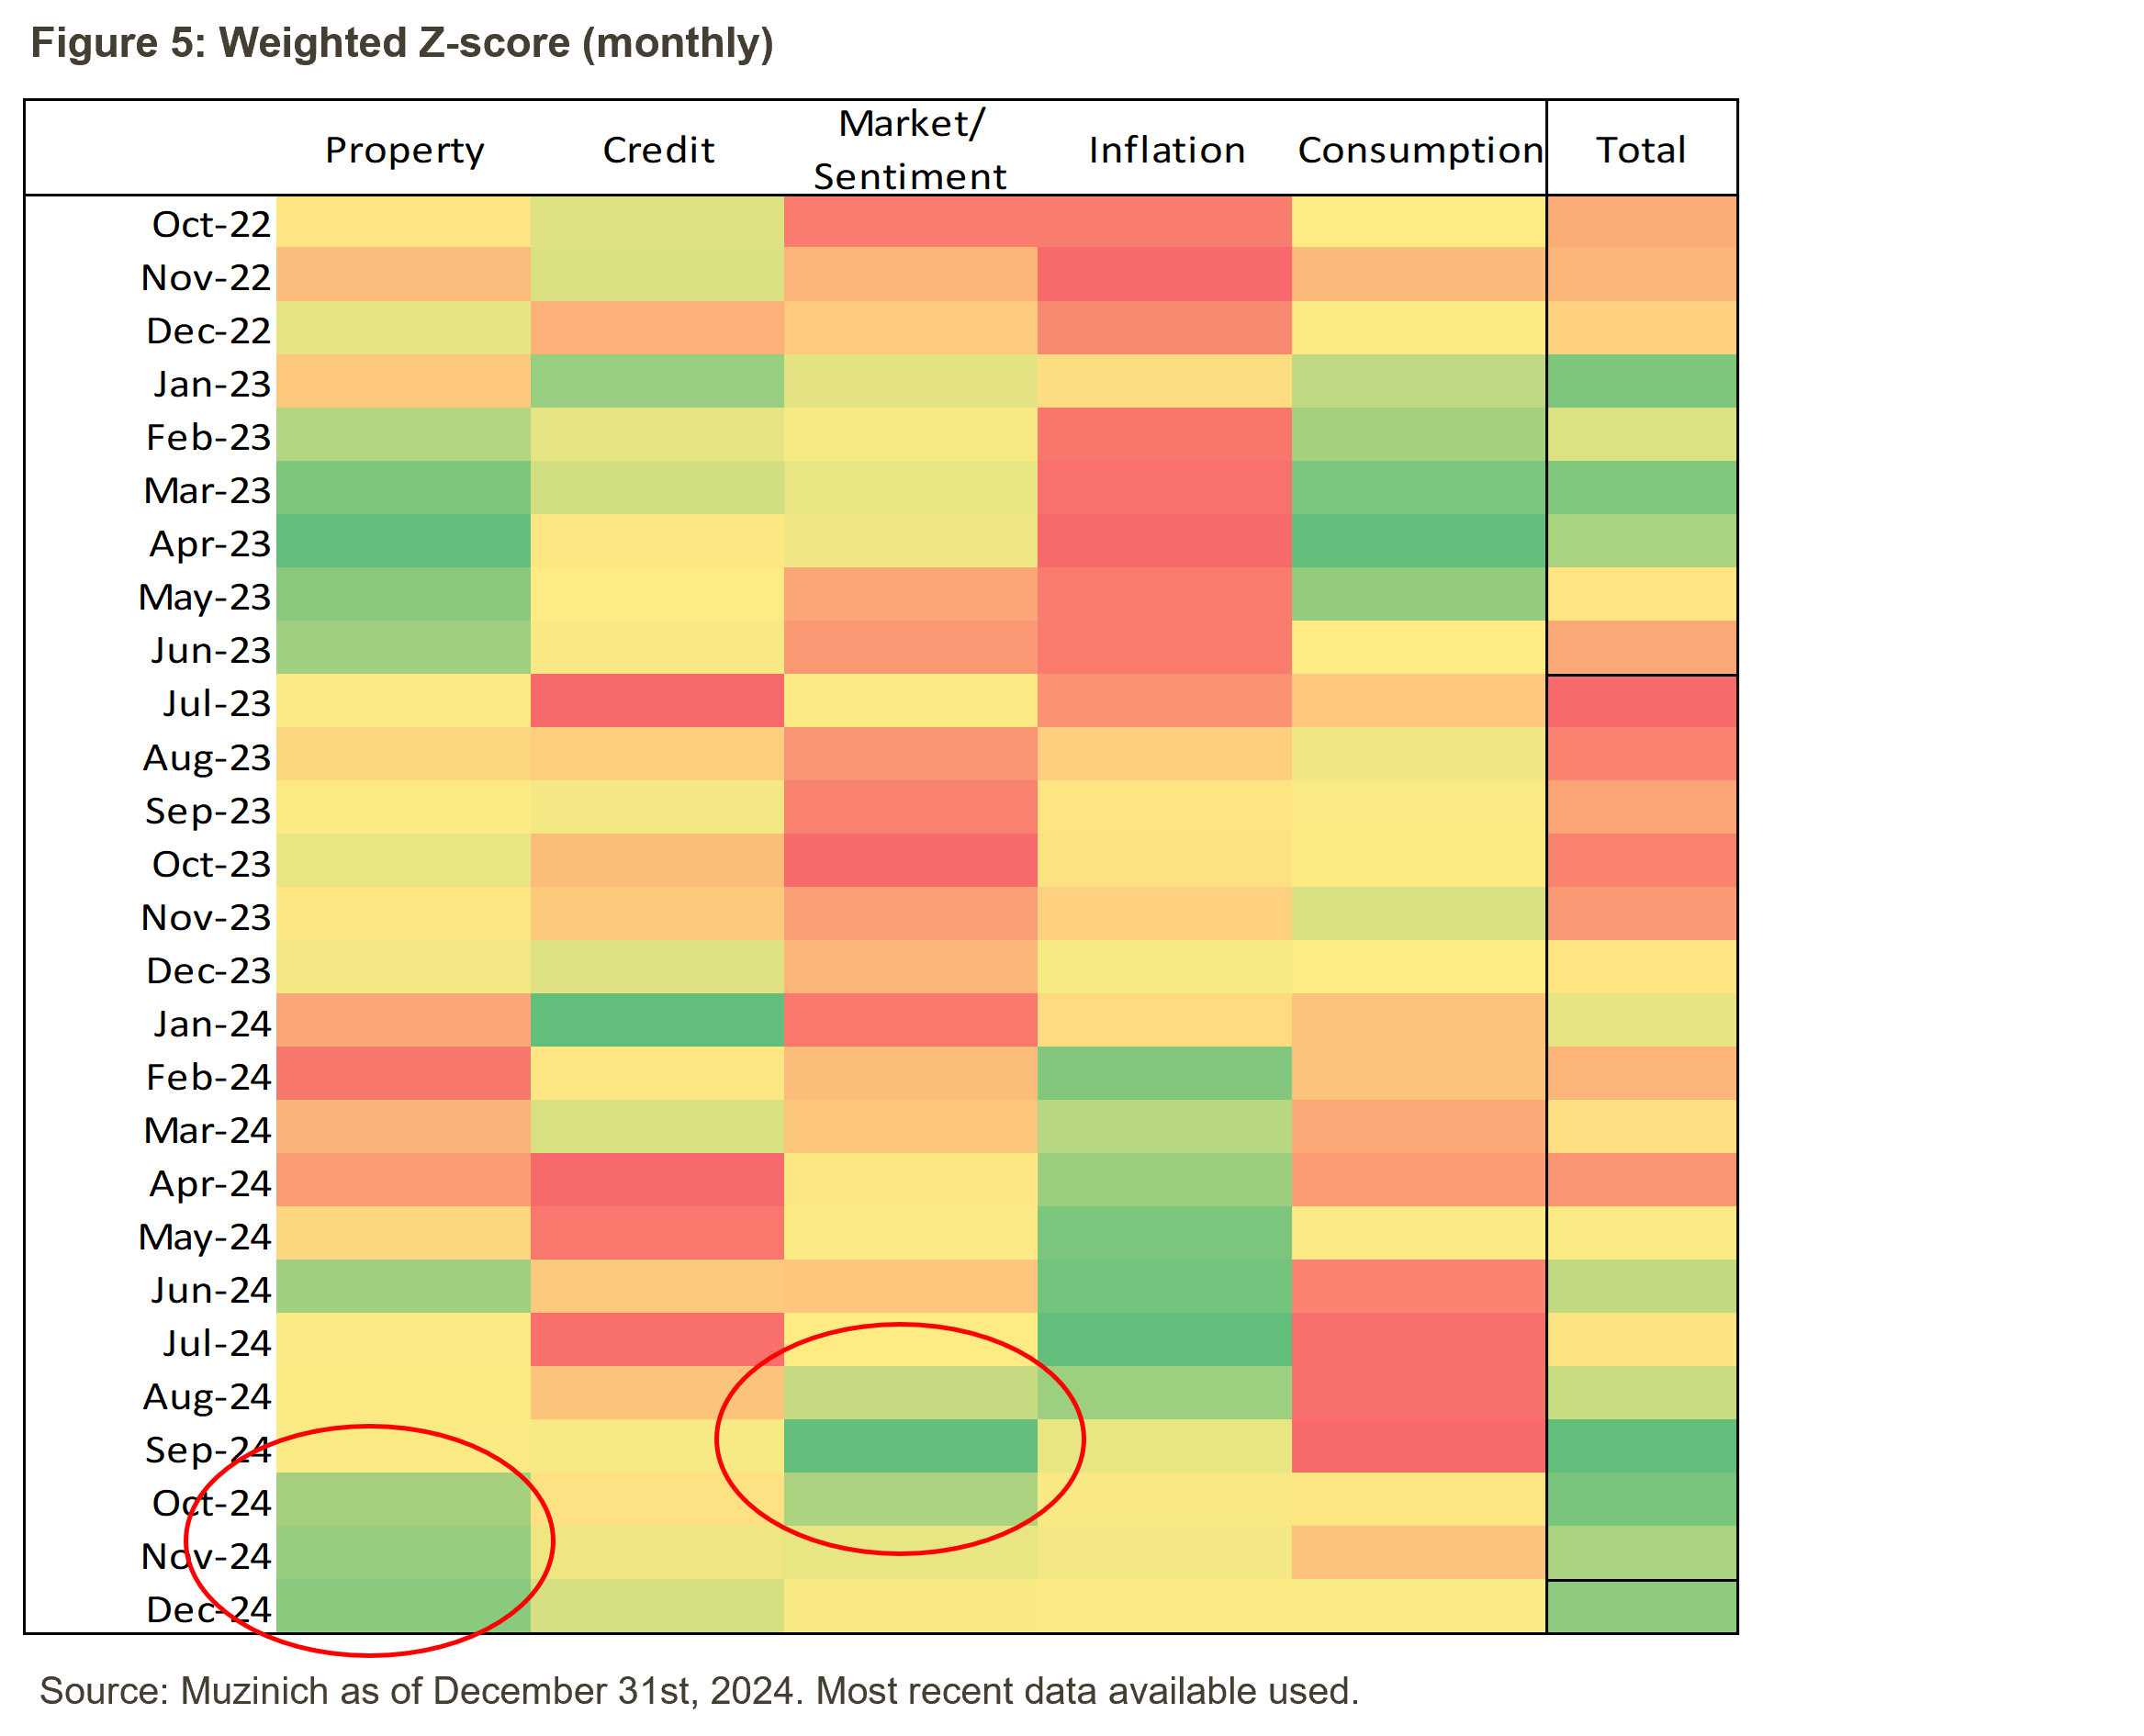
We also noticed this change in sentiment in our China Z-Score (Figure 4). A Z-score indicates how many standard deviations a data point is away from the mean of a dataset; a positive score means the number is above average, a negative score means it is below average.
We believe the spike in September’s Z-Score highlights more positive sentiment. While the measure has since declined, it remains in positive territory due to improving property market indicators. It remains too early to call a bottom to that market, but there are green shoots.
Asian credit has diversified
With Chinese authorities now willing to support the economy, there are signs that global investor interest in Asian credit is increasing. However, for returning investors, the investment universe looks different than it did 4 years ago (Figure 6), with the dominance of China and Chinese real estate notably diminished. At the same time, credit quality has improved (Figure 7), and India now represents the largest weight in the Asia high-yield index.
The rise of India
In recent years, Indian high yield has become an increasingly important part of the Asian credit universe. Already the world’s largest country by population since 2023, India is set to become the third-largest economy by the end of the decade, behind the US and China.7 With a large market and a young, growing population, the country was the fastest-growing large economy in 2024 and is expected to grow between 6.3-6.8% in the 2025-2026 fiscal year.8
The composition of Indian high yield reflects the country’s development. The largest sector is utilities, comprising entirely of renewable energy producers, followed by basic industry. Next is financial services, consisting of non-bank financial institutions that serve parts of the population unable to access traditional banking services. Indian high-yield issuers are predominantly domestically focused, so should be relatively sheltered from tariff and trade war volatility.
The composition of Indian high yield reflects the country’s development. The largest sector is utilities, comprising entirely of renewable energy producers, followed by basic industry. Next is financial services, consisting of non-bank financial institutions that serve parts of the population unable to access traditional banking services. Indian high-yield issuers are predominantly domestically focused, so should be relatively sheltered from tariff and trade war volatility.
Already starting from a high base, the credit quality of Indian high yield has continued to improve, with 76% of the universe rated BB at the end of 2024 compared to 68% at the end of 2020.9 We see potential for positive rating momentum over the medium term, after S&P placed India’s sovereign BBB- rating on positive outlook in May 2024, with the prospect of a rating upgrade over the following 24 months if India’s fiscal deficits continue to decline.
This time it’s different
The return of President Trump appears to be the only similarity 2025 bears to 2017. China is no longer the largest source of US imports, while the country’s focus on more accommodative monetary policy and other pro-growth measures may offset the impact of higher tariffs.
Furthermore, the Asian credit market has become more diverse and of a higher quality. India has overtaken China as the largest weighting in Asian high yield and is set for a period of sustained growth which, if managed appropriately, should result in sovereign rating upgrades. When US dollar funding channels were challenged by rising rates, companies turned to local currency markets instead, leading to lower defaults with the exception of Chinese real estate.
For the moment, Trump and his proclivity for uncertainty is the only constant. In the Year of the Snake, the ability to navigate complex situations, with wisdom and aptitude for strategic planning, could prove advantageous as China and Asia credit investors navigate Trump 2.0.
EM look back – January
Fixed income
Past performance is not a reliable indicator of current or future results.
EM credit
Risk: References to specific companies is for illustrative purposes only and does not reflect the holdings of any specific past or current portfolio or account.
Rating actions
Monetary policy
Country-specific economic news
Risk: References to specific companies is for illustrative purposes only and does not reflect the holdings of any specific past or current portfolio or account.
References
1. CNN, as of 27th January 2025 “Colombia backs down on accepting deportees on military planes after Trump’s tariffs threats”.
2. US Census Bureau, US Bureau of Economic Analysis & Muzinich internal analysis, December 2017 and December 2024.
3. US Census Bureau, US Bureau of Economic Analysis & Muzinich internal analysis, December 2017 and December 2024.
4. Fitch Ratings, as of 16th December 2024 “China’s shifting policy stance points to further easing”
5. The State Council The People’s Republic of China, “China reiterates prudent, neutral monetary policy”, as of 1st October 2017.
6. Asia News Networks, as of 6th January 2025. “China’s “moderately loose” monetary policy expected to deliver policy shift”
7. S&P Global, India Forward, Emerging Perspectives, 19 September 2024
8. Economic Survey. FY26 forecast refers to the financial year ending 31 March 2026.
9. ICE Data Platform, as of 31st December 2020 and 2024, ICE BofA High Yield Emerging Markets Corporate Plus India Issuers Index (EINH).
10. Morgan Global Credit Research, EM Corporate Weekly Monitor – Everything and nothing, as of 31st January 2025.
11. S&P Global, as of 24th January 2025. “Romania ‘BBB-/A-3’ Ratings affirmed; outlook revised to negative from stable on higher fiscal and external risk.
12. Euro news, as of 16th November 2024. “Poland keeps benchmark interest rate steady as inflation lingers above target”.
13. Reuters, as of 30th January 2025 “South Africa trims key rate and models impact of global trade war”.
14. America economia, as of 14th January 2025 “Argentina: inflation in December rose to 2.7% and 2024 closed at 117.8%”
15. Reuters, as of 20th January 2025. “Argentina marks record trade surplus at nearly US$19bn in Milei’s first year as president”.
16. Reuters, as of 30th January 2025. “Argentina central bank cuts interest rate to 29% from 32%”.
17. Bloomberg, as of 15th January 2025 “Indonesia cuts key rate to 5.75%: Decision History”
18. US Census Bureau, as of 28th January 2025.
19. The White House, as of 1st February 2025 and BBC News, “US and Mexico reach deal to put tariffs on hold – for now”, as of 3rd February 2025.
20. CNN, as of 27th January 2025 “Colombia backs down on accepting deportees on military planes after Trump’s tariffs threats”.
21. JP Morgan, as of 29th January 2025. “Upgrade Türkiye to OW: year-end catalysts were good enough”
22. National Bureau of Statistics
23. Voice of America, as of 6th January 2025 “US adds Tencent, CATL to list of Chinese firms allegedly aiding Beijing’s military”
This material is not intended to be relied upon as a forecast, research, or investment advice, and is not a recommendation, offer or solicitation to buy or sell any securities or to adopt any investment strategy. The opinions expressed by Muzinich & Co. are as of February 2025 and may change without notice.
--------
Index descriptions
EMGB - ICE BofA Emerging Markets External Sovereign Index tracks the performance of US dollar and euro denominated emerging markets sovereign debt publicly issued in the major domestic and eurobond markets. Qualifying securities must have risk exposure to countries other than members of the FX-G10, all Western European countries and territories of the US and Western European countries.
EMCB - ICE BofA Emerging Markets Corporate Plus Index tracks the performance of the US dollar and euro denominated emerging markets non-sovereign debt publicly issued in the major domestic and eurobond markets. Qualifying issuers must have risk exposure to countries other than members of the FX G10, all Western European countries, and territories of the US and Western European countries.
EMIB - ICE BofA High Grade Emerging Markets Corporate Plus Index is a subset of the ICE BofA ML Emerging Markets Corporate Plus Index (EMCB) including all securities rated AAA through BBB3, inclusive.
EMHB - ICE BofA High Yield Emerging Markets Corporate Plus Index is a subset of the ICE BofA ML Emerging Markets Corporate Plus Index (EMCB) including all securities rated BB1 or lower.
Q690 - ICE BofA Custom Emerging Markets Short Duration Index tracks the performance of short-term US dollar and euro denominated emerging markets non-sovereign debt publicly issued in the major domestic and eurobond markets.
EMRA - ICE BofA Asia Emerging Markets Corporate Plus Index is the subset of the ICE BofAML Emerging Markets Corporate Plus Index, which includes only securities issued by countries associated with the region of Asia, excluding Kazakhstan, Kyrgyzstan, Tajikistan, Turkmenistan, and Uzbekistan.
EMHA – The ICE BofA High Yield Asia Emerging Markets Corporate Plus Index is a subset of ICE BofA Emerging Markets Corporate Plus Index including all securities rated BB1 and lower with a country of risk within the Asia region.
EMIA - The ICE BofA High Grade Asia Emerging Markets Corporate Plus Index is a subset of ICE BofA Emerging Markets Corporate Plus Index including all securities rated BBB3 and higher with a country of risk within the Asia region.
EMRL - ICE BofA Latin America Emerging Markets Corporate Plus Index is a subset of The ICE BofA Emerging Markets Corporate Plus Index including all securities issued by countries associated with the geographical region of Latin America.
EMIL - The ICE BofA High Grade Latin America Emerging Markets Corporate Index is a subset of ICE BofA Emerging Markets Corporate Plus Index including all securities rated BBB3 and higher with a country of risk within the Latin America region.
EMHL - ICE BofA High Yield Latin America Emerging Markets Corporate Plus is a subset of ICE BofA Emerging Markets Corporate Plus Index including all securities rated sub-investment grade based on the average of Moody's, S&P and Fitch, and with a country of risk associated with the geographical region of Latin America.
EMRE - ICE BofA EMEA Emerging Markets Corporate Plus Index is a subset of The ICE BofA Emerging Markets Corporate Plus Index including all securities issued by countries associated with the geographical region of Europe, the Middle East and Africa including Kazakhstan, Kyrgyzstan, Tajikistan, Turkmenistan and Uzbekistan.
EMIE - ICE BofA High Grade EMEA Emerging Markets Corporate Plus Index is a subset of ICE BofA Emerging Markets Corporate Plus Index including all securities rated BBB3 and higher with a country of risk within the Europe, Middle East and Africa regions.
EMHE - ICE BofA High Yield EMEA Emerging Markets Corporate Plus Index is a subset of ICE BofA Emerging Markets Corporate Plus Index including all securities rated BBB3 and higher with a country of risk within the Europe, Middle East and Africa regions.
The MSCI EM Index is a free-float weighted equity index that captures large and mid cap representation across emerging market countries. The index covers approximately 85% of the free float-adjusted market capitalisation in each country.
LDMP - ICE BofA Local Debt Markets Plus Index is designed to track the performance of emerging markets sovereign debt publicly issued and denominated in the issuer's own currency.
J0A0 - The ICE BofA ML US Cash Pay High Yield Index tracks the performance of US dollar denominated below investment grade corporate debt, currently in a coupon paying period that is publicly issued in the US domestic market.
C0A0 - The ICE BofA ML US Corporate Index tracks the performance of US dollar denominated investment grade corporate debt publicly issued in the US domestic market.
HE00 - The ICE BofA ML Euro High Yield Index tracks the performance of EUR dominated below investment grade corporate debt publicly issued in the euro domestic or eurobond markets.
ER00 – The ICE BofA ML Euro Corporate Index tracks the performance of EUR denominated investment grade corporate debt publicly issued in the eurobond or Euro member domestic markets.
ICE BofA High Yield Emerging Markets Corporate Plus India Issuers Index (EINH) - is a subset of ICE BofA Emerging Markets Corporate Plus Index including all securities with India as the country of risk that are rated sub-investment grade based on average of Moody's, S&P and Fitch
ADOL -The ICE BofA Asian Dollar Index tracks the performance of U.S. dollar denominated sovereign, quasi-government, corporate, securitized and collateralized debt publicly issued in the U.S. domestic and eurobond markets by Asian issuers.
ADHY - ICE BofA Asian Dollar High Yield Index tracks the performance of sub-investment grade U.S. dollar denominated sovereign, quasi-government, corporate, securitized and collateralized debt publicly issued in the U.S. domestic and eurobond markets by Asian issuers.
You cannot invest directly in an index, which also does not take into account trading commissions or costs. Additionally, indices do not include reinvestment of dividends, and the volatility of indices may be materially different over time.
Important information
Muzinich and/or Muzinich & Co. referenced herein is defined as Muzinich & Co., Inc. and its affiliates. Muzinich views and opinions. This material has been produced for information purposes only and as such the views contained herein are not to be taken as investment advice. Opinions are as of date of publication and are subject to change without reference or notification to you. Past performance is not a reliable indicator of current or future results and should not be the sole factor of consideration when selecting a product or strategy. The value of investments and the income from them may fall as well as rise and is not guaranteed and investors may not get back the full amount invested. Rates of exchange may cause the value of investments to rise or fall. Emerging Markets may be more risky than more developed markets for a variety of reasons, including but not limited to, increased political, social and economic instability; heightened pricing volatility and reduced market liquidity.
Any research in this document has been obtained and may have been acted on by Muzinich for its own purpose. The results of such research are being made available for information purposes and no assurances are made as to their accuracy. Opinions and statements of financial market trends that are based on market conditions constitute our judgment and this judgment may prove to be wrong. The views and opinions expressed should not be construed as an offer to buy or sell or invitation to engage in any investment activity, they are for information purposes only.
This discussion material contains forward-looking statements, which give current expectations of future activities and performance. Any or all forward-looking statements in this material may turn out to be incorrect. They can be affected by inaccurate assumptions or by known or unknown risks and uncertainties. Although the assumptions underlying the forward-looking statements contained herein are believed to be reasonable, any of the assumptions could be inaccurate and, therefore, there can be no assurances that the forward-looking statements included in this discussion material will prove to be accurate. In light of the significant uncertainties inherent in the forward-looking statements included herein, the inclusion of such information should not be regarded as a representation that the objectives and plans discussed herein will be achieved. Further, no person undertakes any obligation to revise such forward-looking statements to reflect events or circumstances after the date hereof or to reflect the occurrence of unanticipated events.
United States: This material is for Institutional Investor use only – not for retail distribution. Muzinich & Co., Inc. is a registered investment adviser with the Securities and Exchange Commission (SEC). Muzinich & Co., Inc.’s being a Registered Investment Adviser with the SEC in no way shall imply a certain level of skill or training or any authorization or approval by the SEC.
Issued in the European Union by Muzinich & Co. (Ireland) Limited, which is authorized and regulated by the Central Bank of Ireland. Registered in Ireland, Company Registration No. 307511. Registered address: 32 Molesworth Street, Dublin 2, D02 Y512, Ireland. Issued in Switzerland by Muzinich & Co. (Switzerland) AG. Registered in Switzerland No. CHE-389.422.108. Registered address: Tödistrasse 5, 8002 Zurich, Switzerland. Issued in Singapore and Hong Kong by Muzinich & Co. (Singapore) Pte. Limited, which is licensed and regulated by the Monetary Authority of Singapore. Registered in Singapore No. 201624477K. Registered address: 6 Battery Road, #26-05, Singapore, 049909. Issued in all other jurisdictions (excluding the U.S.) by Muzinich & Co. Limited. which is authorized and regulated by the Financial Conduct Authority. Registered in England and Wales No. 3852444. Registered address: 8 Hanover Street, London W1S 1YQ, United Kingdom. 2024-11-11-14865


Key Takeaways
By clicking "Submit", I am (i) signing up to receive the Opinion Pieces from the "Opinions" page of the Muzinich & Co website, (ii) representing that the above information is true and accurate and (iii) agreeing to join the Muzinich & Co mailing list. I understand that Muzinich & Co will not add retail investors or individuals with personal email addresses to its mailing list and represent that I am not a retail investor. By providing my personal and professional information I am consenting to its use and disclosure in accordance with the Muzinich & Co. Privacy Policy. I understand that I may withdraw my consent and unsubscribe from receiving future communications by clicking "Unsubscribe" from the emails that are sent to me from Muzinich & Co.