September 1, 2026
If you have any feedback on this article or are interested in subscribing to our content, please contact us at opinions@muzinich.com or fill out the form on the right hand side of this page.
--------
As August draws to a close, it is seasonally the peak of the Northern Hemisphere summer lull – a period when markets are normally characterized by thin liquidity, sluggish price action and sparse news flow. Yet it is often in these quiet periods that patterns form, as the paths of least resistance are revealed, setting the tone and direction for the final quarter.
In fixed income, government bonds underperformed their corporate credit peers, a trend we expect to continue. On the economic front, robust activity data across the globe drove growth upgrades, while the disinflation trend lost momentum over the summer and is now showing tentative signs of picking up.
Japan was the worst-performing bond market in August after the Bank of Japan (BoJ) hinted it could accelerate policy normalization as early as September, against a consensus that had looked to December for the next adjustment. Overnight index swaps (OIS) now imply an 85% probability of a 25-basis point (bps) hike in September.[1]
In Europe, the long end of the curve underperformed, with fiscal tolerance as the dominant concern. This was seen most clearly last week, with France's first presidential election debate consumed by bickering over how to deal with the country's rising indebtedness and the urgency of narrowing the budget deficit.[2] Investors are unanimous that the European Central Bank (ECB) will tighten by 25bps in September. The real debate is whether this is the final adjustment. For now, OIS pricing implies a further 25bps hike, to 2.75%, in March 2027.[1]
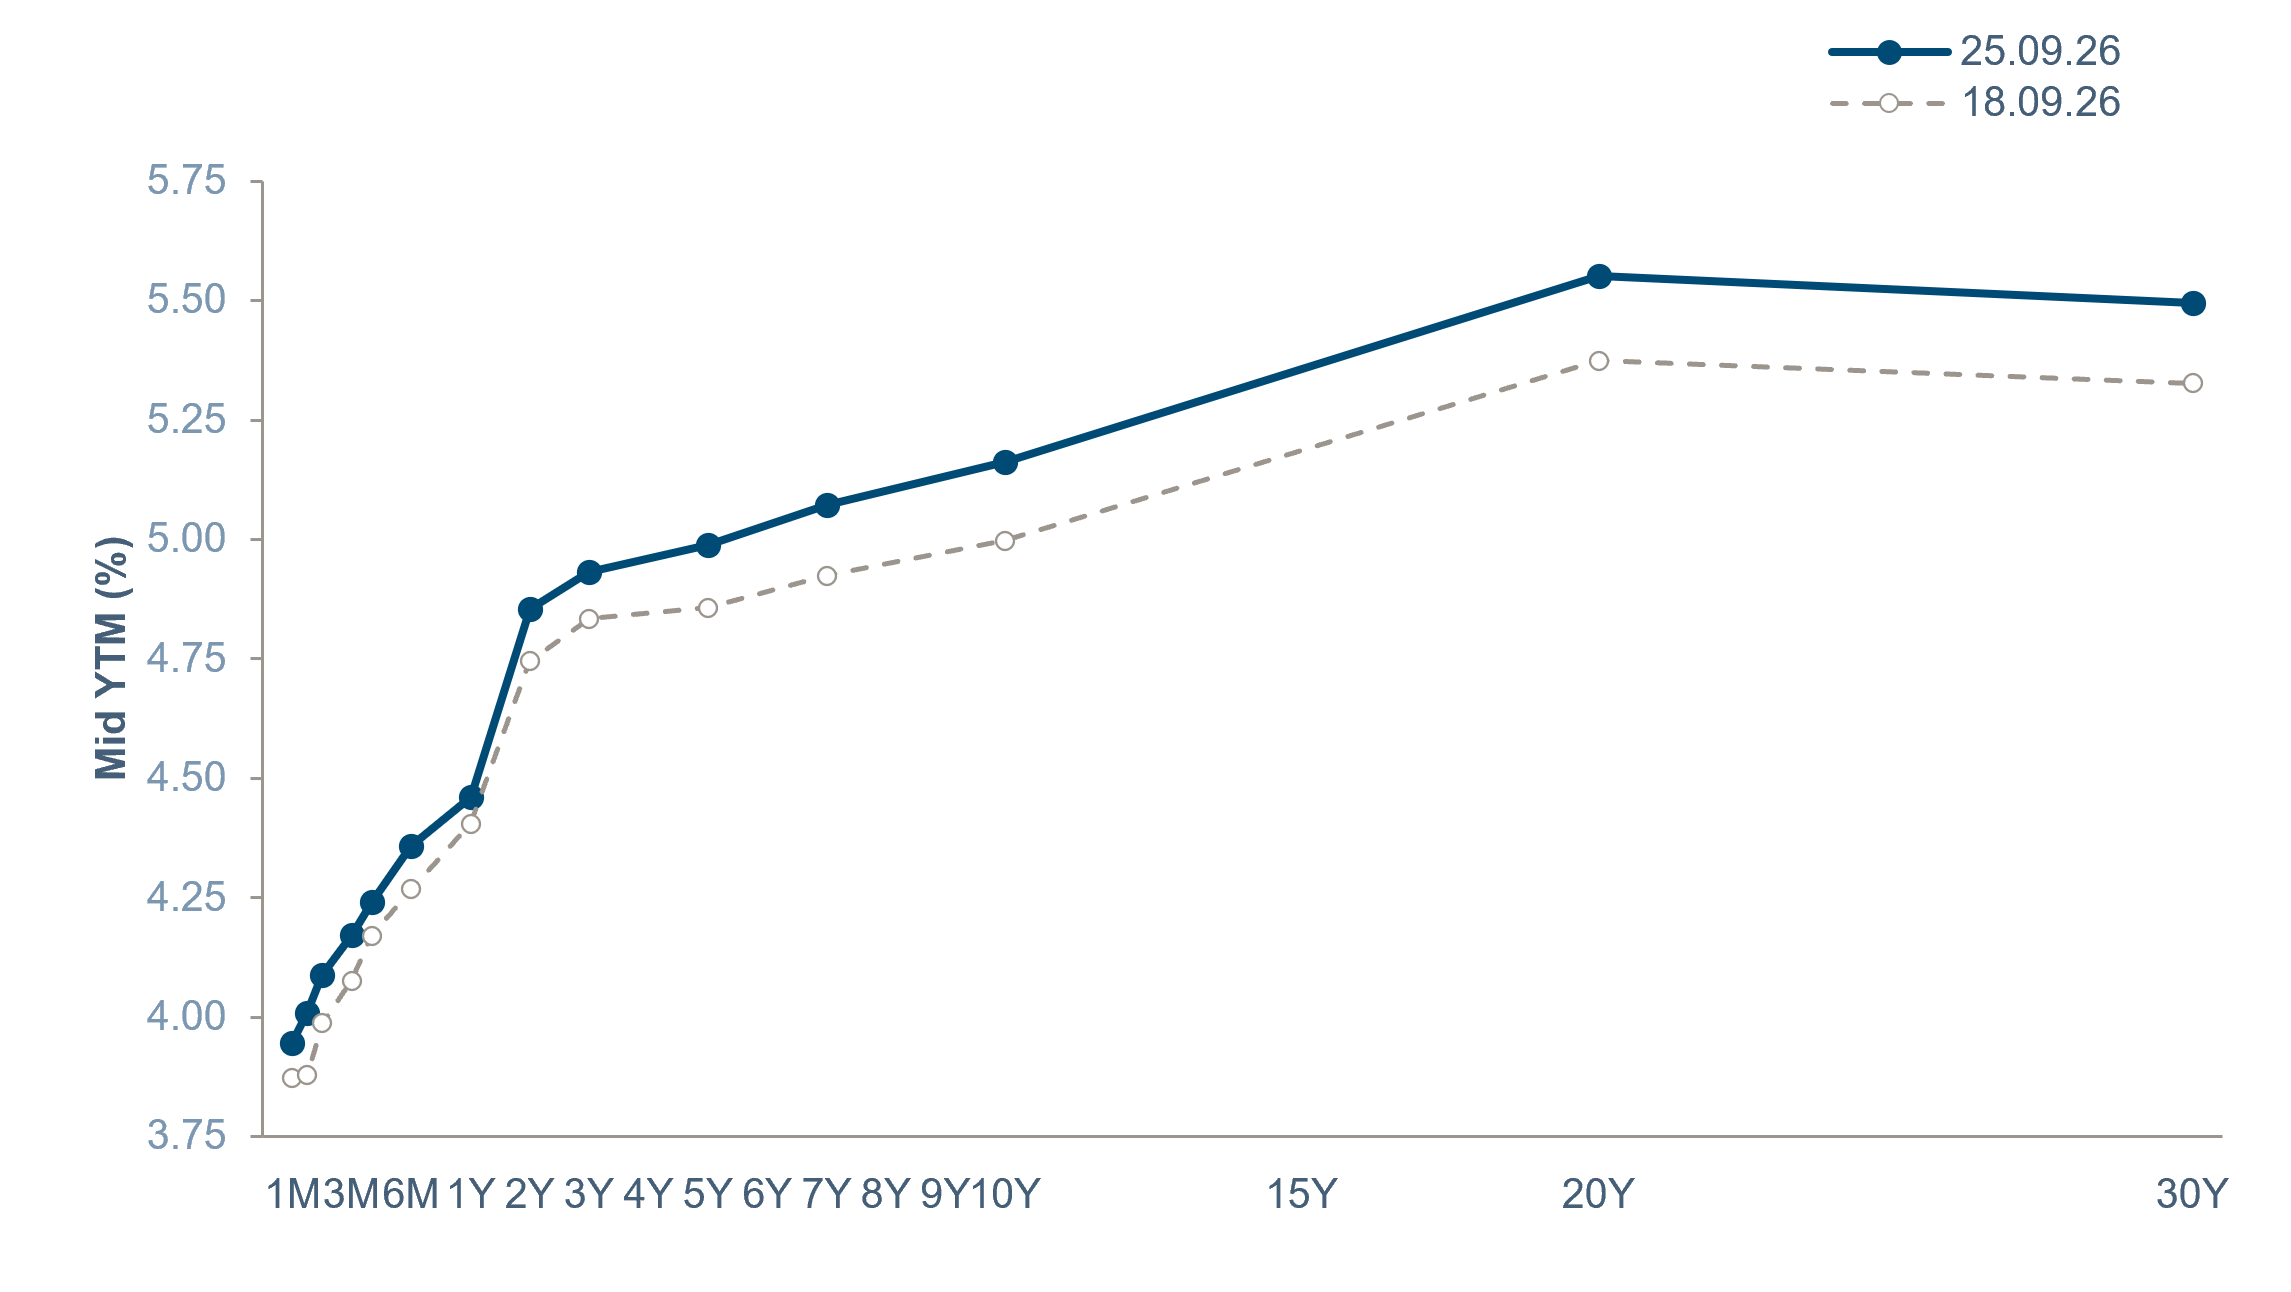
In the US, officials were decidedly not on holiday, and dominated the month's narrative, as investors had to adapt to the new style of Federal Open Market Committee (FOMC) Chair Warsh, who is hawkish leaning, with an explicit preference for constructive ambiguity in policy communication and for letting the market do the committee's work for it. At the same time – and on a collision path with the committee –Treasury Secretary Bessent is trying his utmost to cap US government bond yields or at least slow their rise. If August were the scorecard, Bessent won the day, with US rates outperforming and the curve bull-flattening slightly. The OIS market continues to expect no policy adjustment until December 2026.[1]
In corporate credit, high yield outperformed, buoyed by strong earnings, growth upgrades and a light supply calendar, which together pushed spreads tighter. Meanwhile, US dollar-denominated investment grade benefited from the fall in Treasury yields. We continue to believe the short end of emerging market (EM) debt and high yield offer a constructive way to position for the final quarter of 2026.
In commodities, oil remains the most closely watched market and a bellwether for the Iran situation. Brent crude is broadly unchanged from the end of July, a fair assessment of how negotiations are progressing. On the positive side, Iran and Oman have edged towards an interim agreement on managing shipping through the Strait of Hormuz, and it was reported by The New York Times that the US State Department was preparing to send diplomats back to the region.[3] However, a long-term agreement between Iran and the US appears dead in the water for now.
The fact that crude is not setting new highs also gives clear insight that, regardless of the diplomacy, oil is still flowing through the Strait –by our estimates at between 5 and 9 million barrels per day.[4] Meanwhile, Treasury Secretary Bessent said the US had guided 130 million barrels out through Hormuz over the past 14 days.[5]
Away from crude, and possibly overlooked by investors fixated on oil, gas may offer better clues as to what is in store for the final quarter. Gas prices across Asia and Europe have doubled since the start of the Iran conflict. The Hormuz supply shock is the dominant factor, but residual Russian risk and the prolonged extreme heat across Europe in June and July lifted air-conditioning demand.
In food markets, wheat and corn prices rose to their highest levels in over three years. Strikes between Russia and Ukraine have caused major disruption to both countries' grain exports over recent weeks, adding to an already challenging backdrop for agricultural prices that have been under pressure from the emergent El Niño, this summer's drought across Europe and the disruption to fertilizer exports out of the Gulf.
In metals, gold had its best month since 1999, while industrial metals sit close to record highs. Copper reached US$14,300 a ton in London and is on track for a ninth consecutive weekly gain, the longest such run since 2020.[6] Short-term supply disruptions have dominated price action. Putting the commodity pieces together, the signal is clear: investors should not underestimate the build-up of inflationary pressure from raw materials.
The signal from currency markets was one of US weakness, with the US dollar depreciating against every G10 currency except, interestingly, the Japanese yen – after investors pushed back against coordinated intervention – and against most EM currencies as well. One theory circulating is that if US Treasury yields are going to be capped, investors must be compensated by being able to buy US assets more cheaply. A weaker US dollar allows them to buy more per unit of domestic currency. However, rate differentials are the more grounded rationale. The FOMC is not expected to adjust policy until December, and even that is hotly debated, while a string of central banks is now expected to move before the Federal Reserve, including the BoJ, the majority of Asian central banks and the ECB. The Bank of Korea hiked to 3% last week, with the Korean won being one of the strongest currencies in August, appreciating almost 5% against the US dollar. Maybe Asian central banks have one eye on commodity input prices.
Equity markets saw a melt-up, with the Bloomberg World Large & Mid Cap Index up over 3% in August as technology came back into favour. Indices heavily weighted towards technology outperformed on the month, with confidence returning after a weak July. Sentiment significantly improved after Nvidia, the chipmaker at the heart of the artificial intelligence boom, said revenue will grow around 70% next fiscal year, easing concerns that AI spending is poised to lose momentum. The projected sales growth for fiscal 2028 outstrips analysts' estimates of a 45% jump, according to data compiled by Bloomberg.[7]
Looking deeper, something more interesting emerges. Year-to-date, the Russell 2000 Value Index, which has only around 5% allocated to technology, has outperformed both the Nasdaq and the S&P 500.[8] This is exactly what we would expect in the environment we have described, one of hiking central banks, commodity prices at multi-year highs and stalling disinflation. The index is heavily weighted towards financials, energy and materials – the sectors that benefit most from precisely those conditions.
As for market sentiment, our preferred gauge, the VIX, is now below 15, an indication that all is well, uncertainty is manageable, and investors are confident about the near future. Perfect timing, given that September is seasonally one of the more difficult months of the calendar year. Outside commodities and the US dollar, it has been hard to make a total return over the past ten Septembers, as the table below shows (see Chart of the Week). Reviewing the root cause of that poor performance, the common denominator is rising government bond yields.
Chart of the Week: September Seasonality

Source: Bloomberg, as of August 28, 2026. Muzinich views and opinions are subject to change. For illustrative purposes only, not to be construed as investment advice or an invitation to engage in any investment activity.
Past performance is not a reliable indicator of current or future results.
References to specific companies is for illustrative purposes only and does not reflect the holdings of any specific past or current portfolio or account.
References
[1] Bloomberg, as of August 28. 2026
[2] Bloomberg, “France’s Debt Difficulties Dominate First Presidential Debate,” August 27, 2026
[3] The New York Times, “U.S. Said to Be Returning Diplomats to Middle East Embassies,” August 25, 2026
[4] Muzinich Weekly Market Comment, “August Lull,” August 17, 2026
[5] Bloomberg, “US Commander Declares Hormuz Shipping Langes Are Mine-Free,” August 27, 2026
[6] Bloomberg, “Copper on Cusp of Record High Heads for Ninth Weekly Advance,” August 28, 2026
[7] Bloomberg, “Nvidia Sees AI-Fueled Demand Boosting Sales 70% Next Year,” August 27, 2026
[8] Bloomberg, as of August 28, 2026
This material is not intended to be relied upon as a forecast, research, or investment advice, and is not a recommendation, offer or solicitation to buy or sell any securities or to adopt any investment strategy. The opinions expressed by Muzinich & Co. are as of August 28, 2026, and may change without notice. All data figures are from Bloomberg, as of August 28, 2026, unless otherwise stated.
--------
Index Descriptions
1. FTSE 100 Index – The FTSE 100 Index is a capitalization-weighted index of the 100 most highly capitalized companies traded on the London Stock Exchange. The equities use an investability weighting in the index calculation. The index was developed with a base level of 1000 as of December 30, 1983.
2. Bloomberg World Large & Mid Cap Price Return Index – Bloomberg World Large & Mid Cap Price return index is a float market-cap-weighted equity benchmark that covers the top 86% of market cap of the measured market.
3. MSCI World Index – The MSCI World Index is a free-float weighted equity index. It was developed with a base value of 100 as of December 31, 1969. MXWO indexed developed world markets and does not include emerging markets. MXWD includes both emerging and developed markets.
4. MSCI Emerging Markets Index – The MSCI EM Index is a free-float weighted equity index that captures large and mid cap representation across emerging market countries. The index covers approximately 85% of the free float-adjusted market capitalisation in each country.
5. ICE BofA US Cash Pay High Yield Index – The ICE BofA US Cash Pay High Yield Index tracks the performance of US dollar denominated below investment grade corporate debt, currently in a coupon paying period that is publicly issued in the US domestic market. Qualifying securities must have a below investment grade rating (based on an average of Moody’s, S&P and Fitch), at least 18 months to final maturity at the time of issuance, at least one year remaining term to final maturity as of the rebalancing date, a fixed coupon schedule and a minimum amount outstanding of $250 million.
6. ICE BofA Euro High Yield Index – The ICE BofA Euro High Yield Index tracks the performance of EUR denominated below investment grade corporate debt publicly issued in the euro domestic or eurobond markets. Qualifying securities must have a below investment grade rating (based on an average of Moody’s, S&P and Fitch), at least 18 months to final maturity at the time of issuance, at least one year remaining term to final maturity, a fixed coupon schedule and a minimum amount outstanding of EUR 250 million.
7. ICE BofA High Yield US Emerging Markets Liquid Corporate Plus Index – The ICE BofA High Yield US Emerging Markets Liquid Corporate Plus Index is a subset of The ICE BofA US Emerging Markets Liquid Corporate Plus Index including all securities rated BB1 or lower. The ICE BofA US Emerging Markets Liquid Corporate Plus Index tracks the performance of U.S. dollar denominated emerging markets non-sovereign debt publicly issued in the major domestic and eurobond markets.
8. ICE BofA US Corporate Index – The ICE BofA US Corporate Index tracks the performance of US dollar denominated investment grade corporate debt publicly issued in the US domestic market. Qualifying securities must have an investment grade rating (based on an average of Moody’s, S&P and Fitch), at least 18 months to final maturity at the time of issuance, at least one year remaining term to final maturity as of the rebalancing date, a fixed coupon schedule and a minimum amount outstanding of $250 million.
9. ICE BofA Euro Corporate Index – The ICE BofA Euro Corporate Index tracks the performance of EUR denominated investment grade corporate debt publicly issued in the eurobond or Euro member domestic markets. Qualifying securities must have an investment grade rating (based on an average of Moody’s, S&P and Fitch), at least 18 months to final maturity at the time of issuance, at least one year remaining term to final maturity, a fixed coupon schedule and a minimum amount outstanding of EUR 250 million.
10. ICE BofA High Grade Emerging Markets Corporate Plus Index – The ICE BofA High Grade Emerging Markets Corporate Plus index is a subset of the ICE BofA Emerging Markets Corporate Plus Index (EMCB) including all securities rated AAA through BBB3, inclusive.
11. XAU/USD Spot Exchange Rate (gold spot price, quoted in US dollars per troy ounce) – XAUUSD Spot Exchange Rate – price of 1XAU in USD Gold. The gold spot price is quoted as US Dollars per Troy Ounce. Gold Cross rates are available using XAU followed by 3-character ISO code of the cross currency.
12. ICE Brent crude futures – Current pipeline export quality Brent blend as supplied at Sullom Voe. ICE Brent futures is a deliverable contract based on EFP delivery with an option to cash settle. Date of launch: 23rd June 1988.
14. US Dollar Index (USDX) – The US Dollar index (USDX) indicates the general int’l value of the USD. The USDX does this by averaging the exchange rates between the USD and major world currencies. The ICE US computes this by using the rates supplied by some 500 banks.
15. Bloomberg Bitcoin Index – Bloomberg Bitcoin Index is designed to measure the performance of the digital asset Bitcoin traded in USD. Please note, use as a financial benchmark may be restricted.
16. ICE BofA 7-10 Year UK Gilt Index – The ICE BofA 7-10 Year UK Gilt Index is a subset of the ICE BofA UK Gilt Index (G0L0) including all securities with a remaining term to final maturity greater than or equal to 7 years and less than 10 years.
17. ICE US Treasury 7-10 Year Bond Index – ICE U.S. Treasury 7-10 Year Bond Index tracks the performance of US dollar denominated sovereign debt publicly issued by the US government in its domestic market. Qualifying securities must have greater than seven years and less than or equal to ten years remaining term to final maturity as of the rebalancing date, a fixed coupon schedule and an adjusted amount outstanding of at least $300 million. The amount outstanding for all qualifying securities is adjusted to reduce by the amounts held by the Federal Reserve’s SOMA account. Bills, inflation-linked debt, original issue zero coupon securities and STRIPs are excluded from the Index; however, the amounts outstanding of qualifying coupon securities are not reduced by any portions that have been stripped. Agency debt with or without a US Government guarantee and securities issued or marketed primarily to retail investors do not qualify for inclusion in the index.
18. ICE BofA 7-10 Year Euro Government Index – ICE BofA 7-10 Year Euro Government Index is a subset of ICE BofA Euro Government Index including all securities with a remaining term to final maturity greater than or equal to 7 years and less than 10 years.
Important Information
Muzinich & Co., “Muzinich” and/or the “Firm” referenced herein is defined as Muzinich & Co. Inc. and its affiliates. This material has been produced for information purposes only and as such the views contained herein are not to be taken as investment advice. Opinions are as of date of publication and are subject to change without reference or notification to you. Past performance is not a reliable indicator of current or future results and should not be the sole factor of consideration when selecting a product or strategy. The value of investments and the income from them may fall as well as rise and is not guaranteed and investors may not get back the full amount invested. Rates of exchange may cause the value of investments to rise or fall. Emerging Markets may be more risky than more developed markets for a variety of reasons, including but not limited to, increased political, social and economic instability, heightened pricing volatility and reduced market liquidity. Any research in this document has been obtained and may have been acted on by Muzinich for its own purpose. The results of such research are being made available for information purposes and no assurances are made as to their accuracy. Opinions and statements of financial market trends that are based on market conditions constitute our judgment and this judgment may prove to be wrong. The views and opinions expressed should not be construed as an offer to buy or sell or invitation to engage in any investment activity, they are for information purposes only. Any forward-looking information or statements expressed in the above may prove to be incorrect. In light of the significant uncertainties inherent in the forward-looking statements included herein, the inclusion of such information should not be regarded as a representation that the objectives and plans discussed herein will be achieved. Muzinich gives no undertaking that it shall update any of the information, data and opinions contained in the above.
United States: This material is for Institutional Investor use only – not for retail distribution. Muzinich & Co., Inc. is a registered investment adviser with the Securities and Exchange Commission (SEC). Muzinich & Co., Inc.’s being a Registered Investment Adviser with the SEC in no way shall imply a certain level of skill or training or any authorization or approval by the SEC.
United Arab Emirates (UAE): This information is provided for discussion and informational purposes only and does not constitute an offer or solicitation in the UAE. It is intended solely for Professional Investors and should not be relied upon by any other person. This material has not been reviewed or approved by the UAE Securities and Commodities Authority, the UAE Central Bank or any other relevant authority. Nothing contained herein constitutes investment, legal, tax or other professional advice. Recipients should make their own independent assessment where appropriate.
Abu Dhabi Global Market (ADGM): This information is provided for discussion and informational purposes only and does not constitute an offer or solicitation in the ADGM. It is intended solely for Professional Clients (as defined by the Financial Services Regulatory Authority) and should not be relied upon by any other person. This material has not been reviewed or approved by the Financial Services Regulatory Authority or any other relevant authority in the UAE.
Issued in the European Union by Muzinich & Co. (Ireland) Limited, which is authorized and regulated by the Central Bank of Ireland. Registered in Ireland, Company Registration No. 307511. Registered address: 32 Molesworth Street, Dublin 2, D02 Y512, Ireland. Issued in Switzerland by Muzinich & Co. (Switzerland) AG. Registered in Switzerland No. CHE-389.422.108. Registered address: Tödistrasse 5, 8002 Zurich, Switzerland. Issued in Singapore and Hong Kong by Muzinich & Co. (Singapore) Pte. Limited, which is licensed and regulated by the Monetary Authority of Singapore. Registered in Singapore No. 201624477K. Registered address: 6 Battery Road, #26-05, Singapore, 049909. Issued in all other jurisdictions (excluding the U.S.) by Muzinich & Co. Limited. which is authorized and regulated by the Financial Conduct Authority. Registered in England and Wales No. 3852444. Registered address: 8 Hanover Street, London W1S 1YQ, United Kingdom.